Finding the Optimal Resolution for Ice-Ocean 2D Simulations
Date:
Here we present results from our 2D simulations, where we varied the model resolution to determine the optimal configuration. We analyze the evolution of key physical properties and compute the melt rate.
The governing equations are as follows:
\[\frac{\partial \mathbf{u}}{\partial t} + (\mathbf{u} \cdot \nabla) \mathbf{u} = -\frac{1}{\rho_0} \nabla p + \nu \nabla^2 \mathbf{u} + \mathbf{g} \rho \\ \nabla \cdot \mathbf{u} = 0 \\ \frac{\partial T}{\partial t} + (\mathbf{u} \cdot \nabla) T = \kappa_T \nabla^2 T - \frac{1}{\sigma}(T - T_{\text{bot}}) r(z) \\ \frac{\partial S}{\partial t} + (\mathbf{u} \cdot \nabla) S = \kappa_S \nabla^2 S - \frac{1}{\sigma}(S - S_{\text{bot}}) r(z)\]The setup represents melting at the ice-ocean boundary located at the top. At the bottom of the domain, we incorporate a sponge layer that restores salinity and temperature to specified values. The restoring function is defined as $r(z) = 0.5 \left( \tanh(-10 - 2z) + 1 \right)$. The dynamic viscosity ($\nu$), the thermal diffusivity ($\kappa_T$) and the salinity diffusivity ($\kappa_S$) are fixed at $1.8 \times 10^{-6}$, so our Lewis number is equal to 1. The density profile is calculated based on the linear approximation: $\rho = \rho_0 \left[ 1 - \beta_T (T - T_0) + \beta_S (S - S_0) \right]$, where $\rho_0 = 1000 \, \text{kg/m}^3$, $T_0 = 277.15 \, \text{K}$, and $S_0 = 0 \, \text{g/kg}$. The thermal expansion coefficient is $\beta_T = 3.87 \times 10^{-5} \, \text{K}^{-1}$, and the haline contraction coefficient is $\beta_S = 7.86 \times 10^{-4} \, \text{(g/kg)}^{-1}$. Finally, the melting temperature ($T_{\text{melt}}$) is determined by the equation: $ T_{\text{melt}} = \lambda_1 S + \lambda_2$ where $\lambda_1 = -5.73 \times 10^{-2} \, \text{K/(g/kg)}$ and $\lambda_2 = 8.32 \times 10^{-2} \, \text{K}$.
The initial conditions are:
- $T_i(x, z) = 273.3 \, \text{K}$
- $S_i(x, z) = 34.572 \, \text{g/kg}$
The domain size is $L_x = 6 \, \text{m}$ and $L_z = 8 \, \text{m}$. The spatial resolution is varied, taking values of 256, 512, and 1024 grid points. The simulation runs for a total of 1 hour, with outputs recorded every minute.
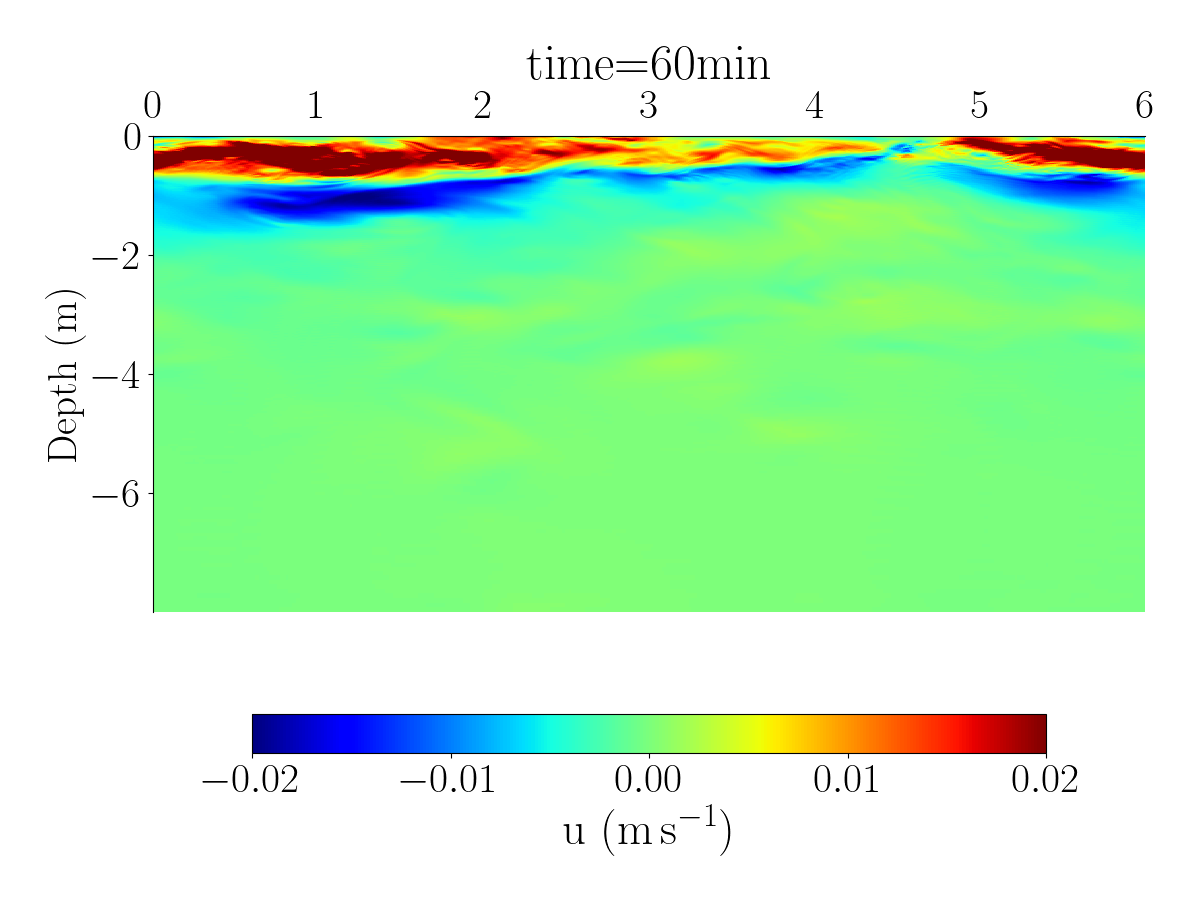
Fig.1 and Fig.2 shows the spatial distribution of the horizontal velocity, temperature and salinity using differents spatial resolutions. 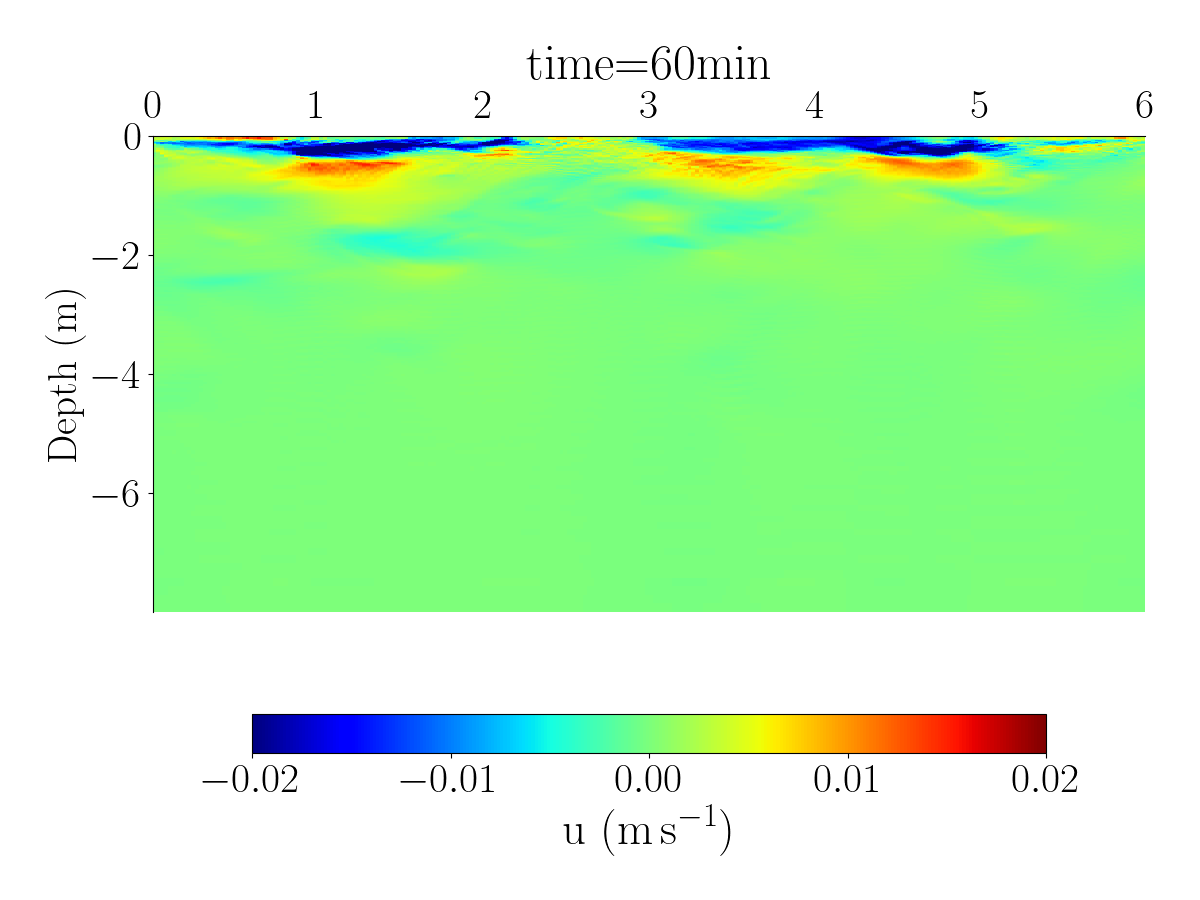
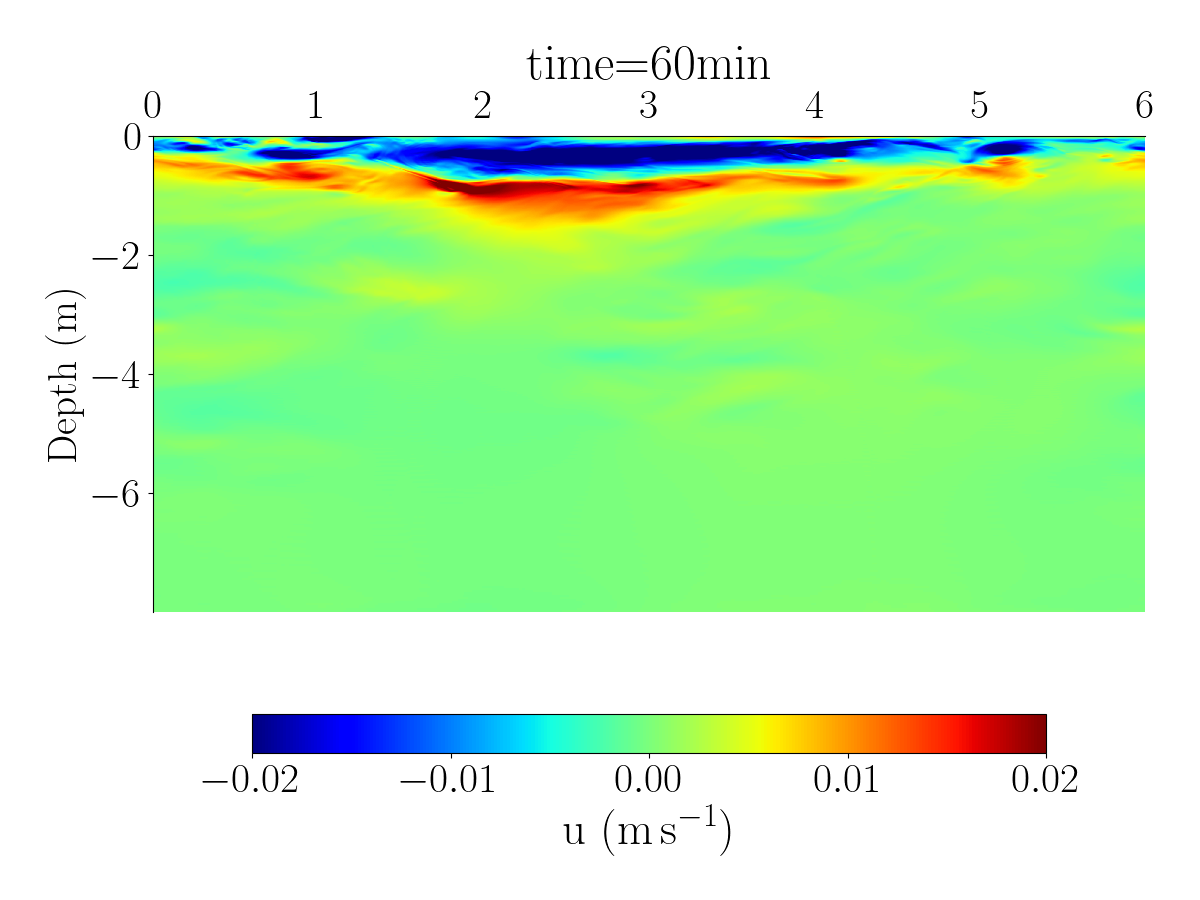
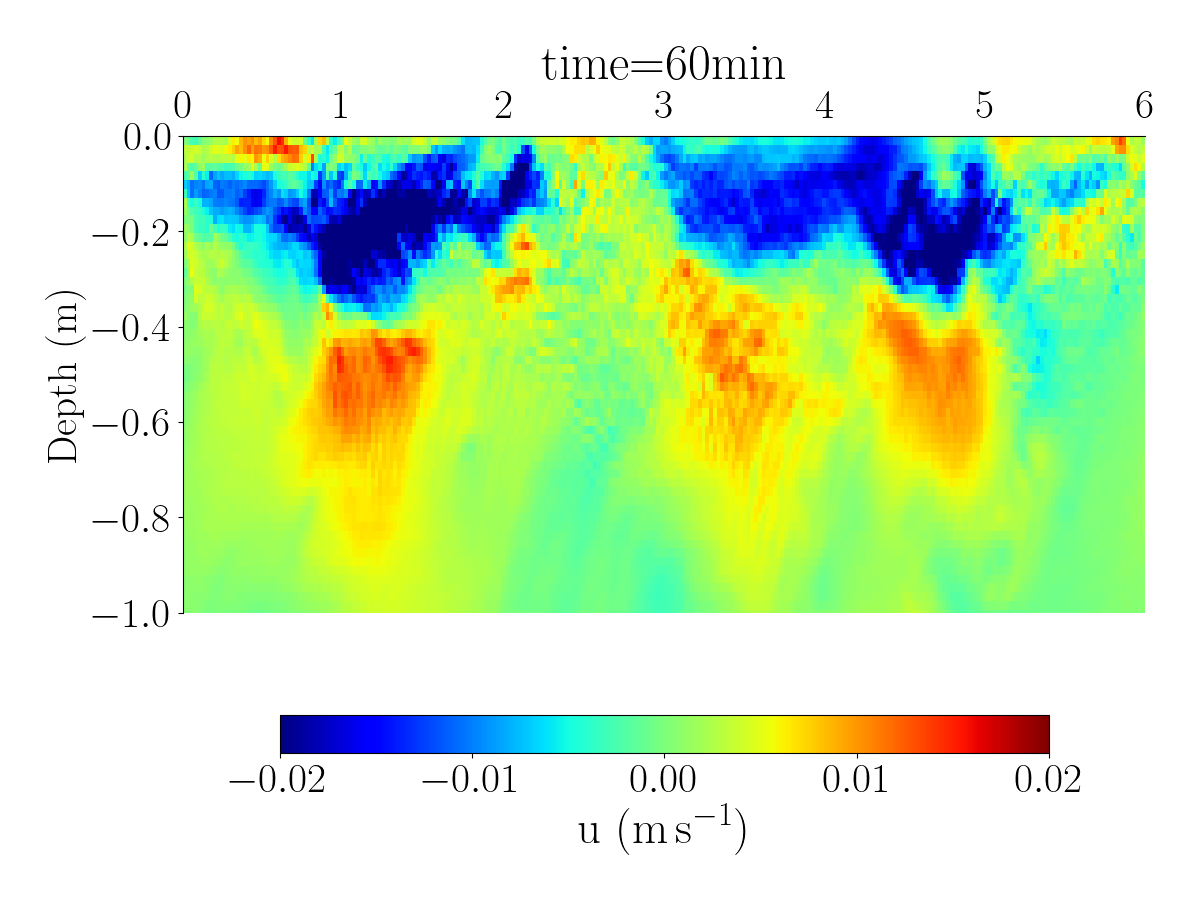
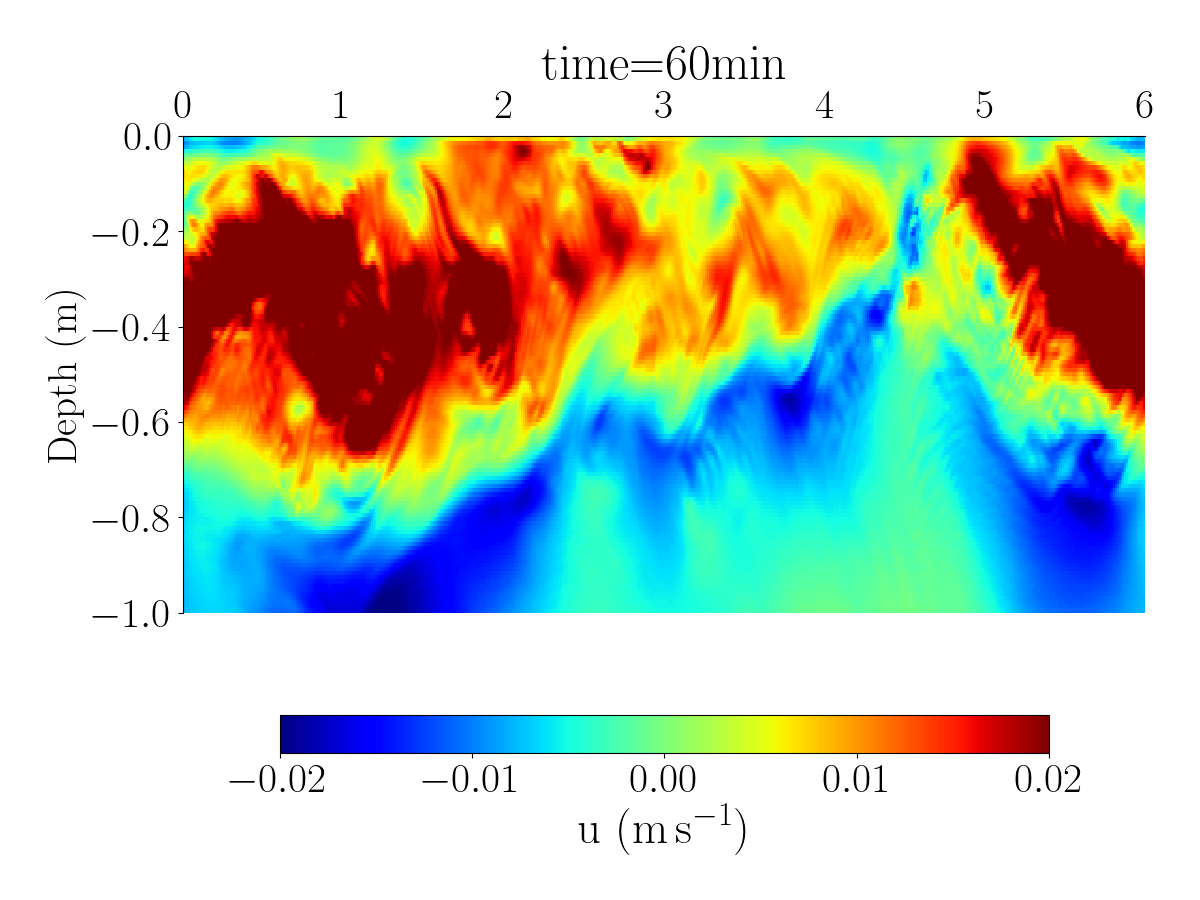
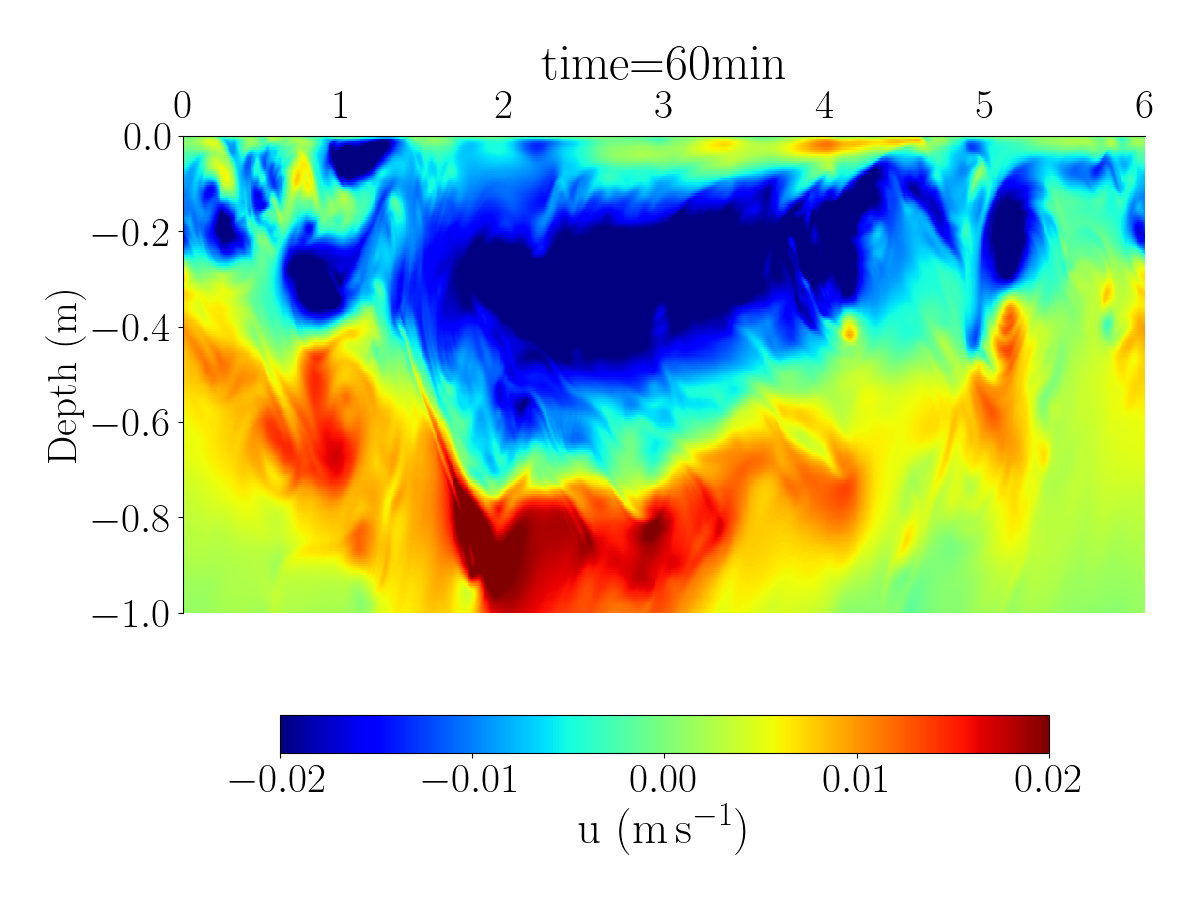
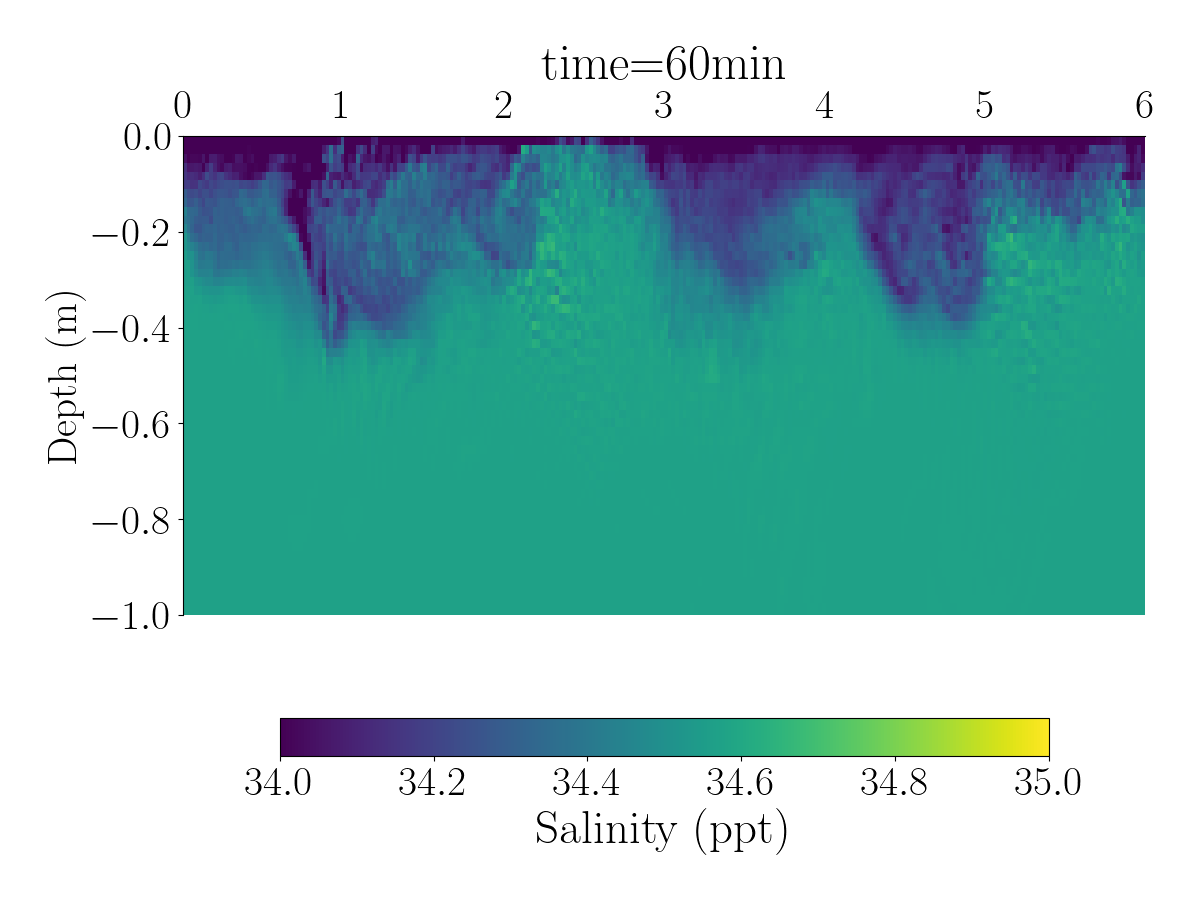
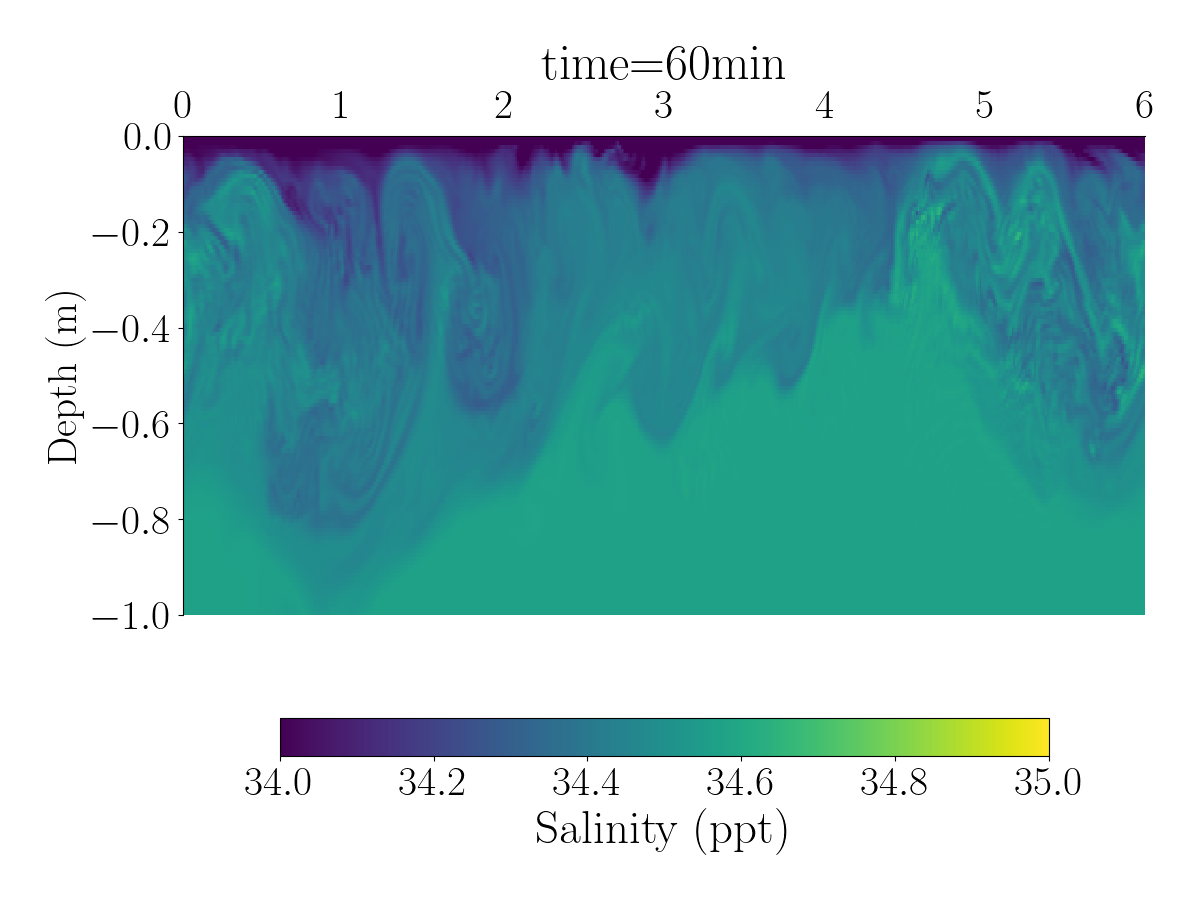
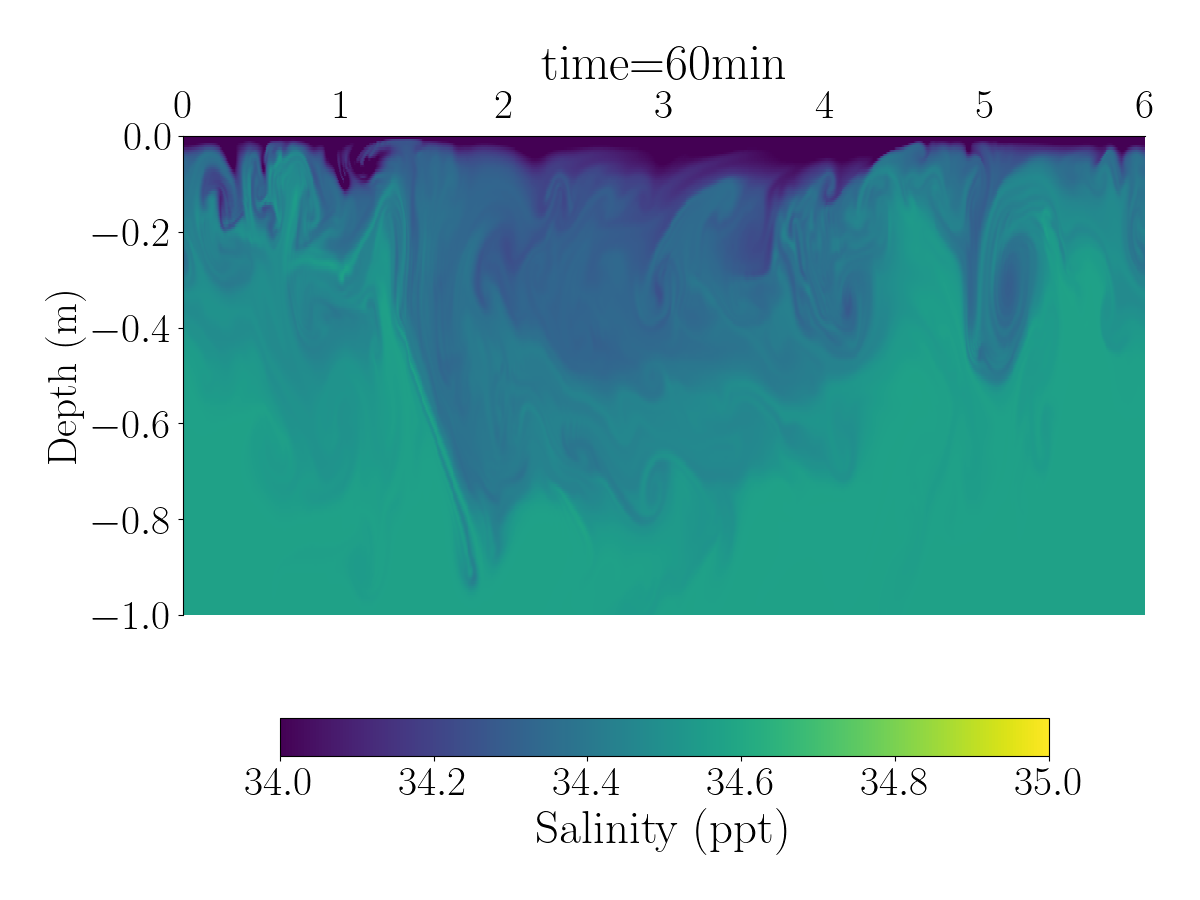
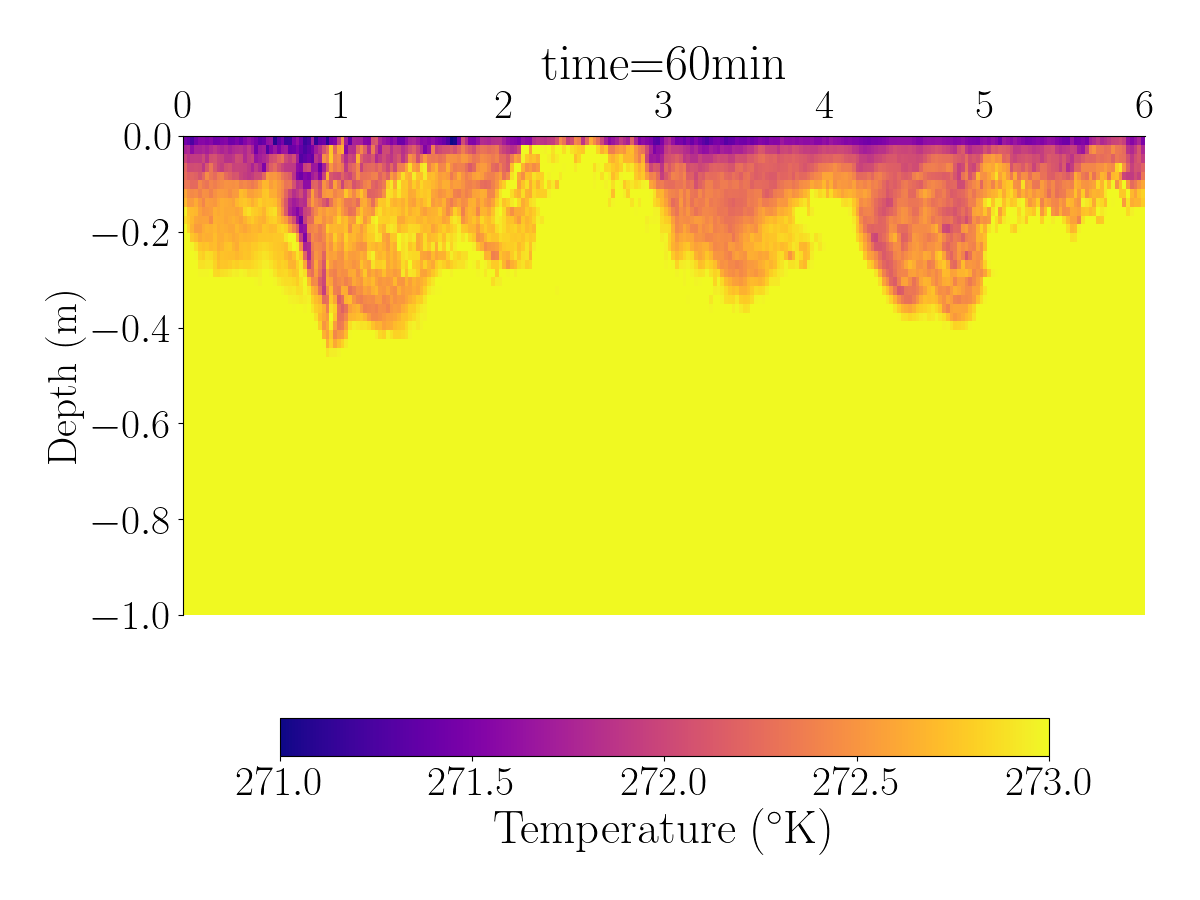
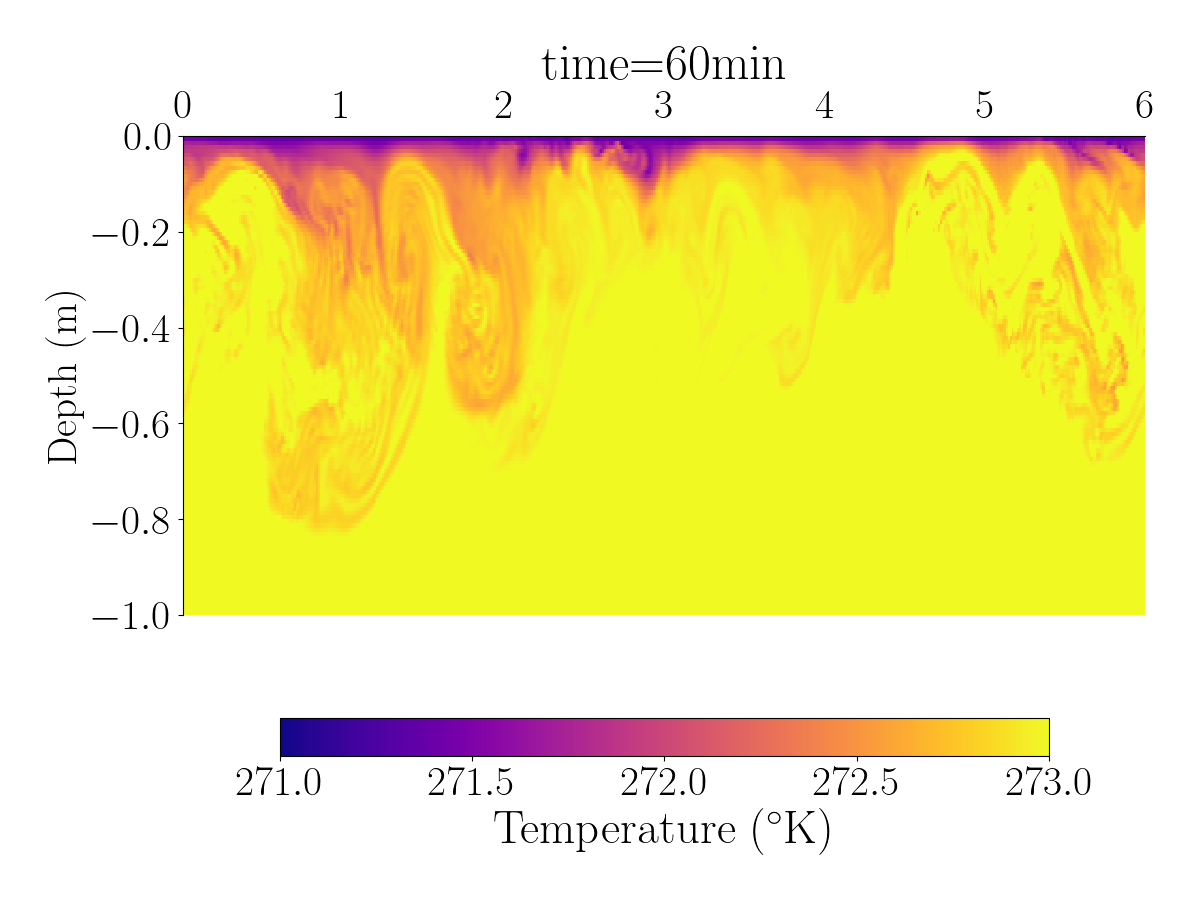
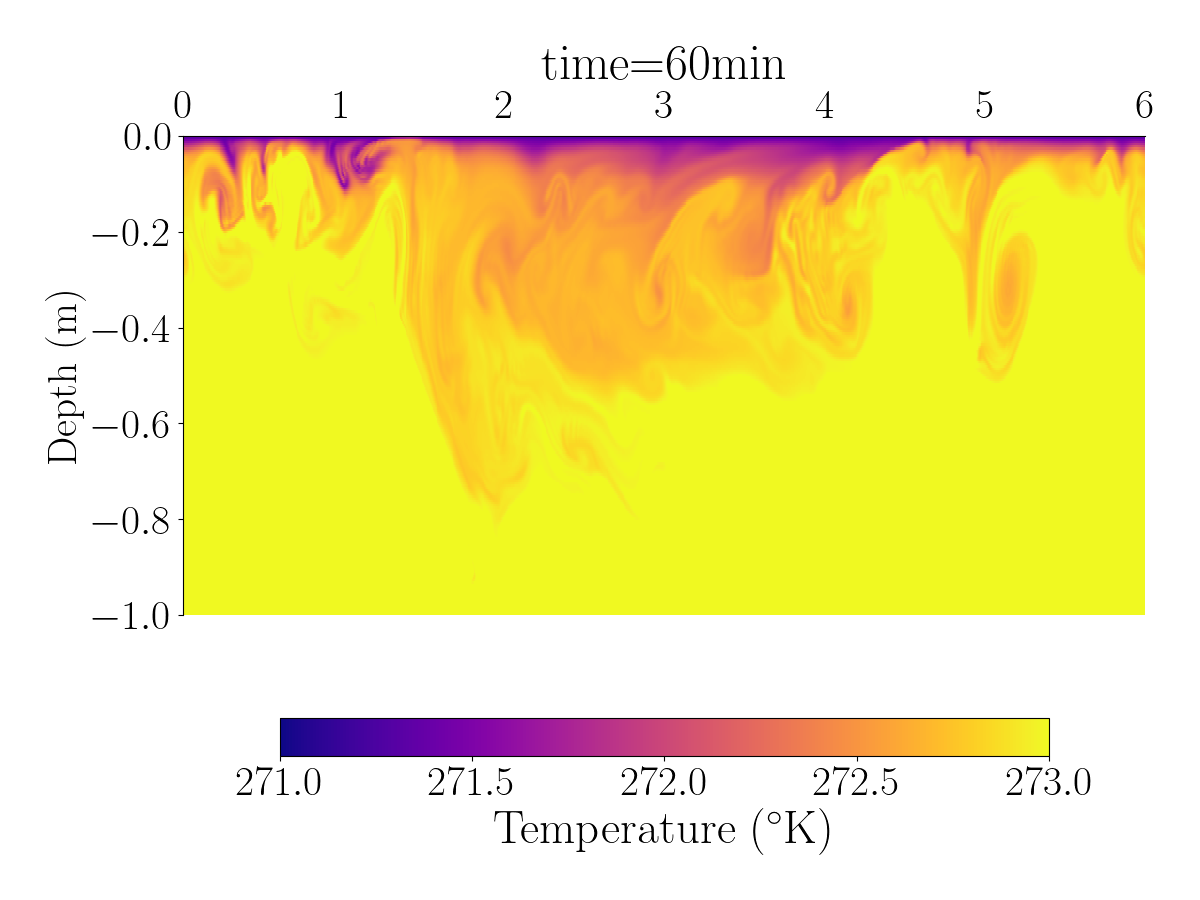
The videos below show the evolution of the velocity, salinity, and temperature for the simulation with 1024 grid points.
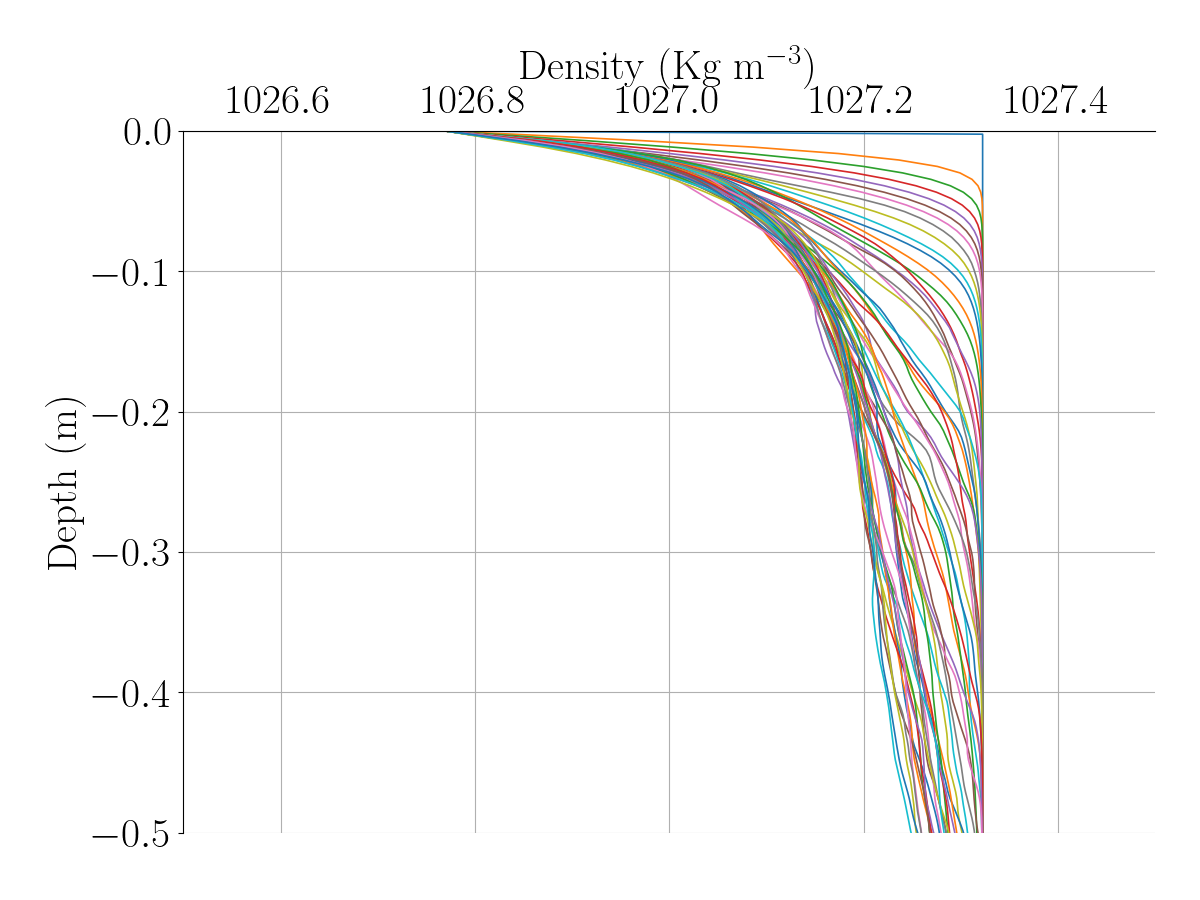
Fig.3 displays the evolution of the salinity and temperature profiles. We observe a decrease in both quantities as time progresses, as expected due to the melting configuration. 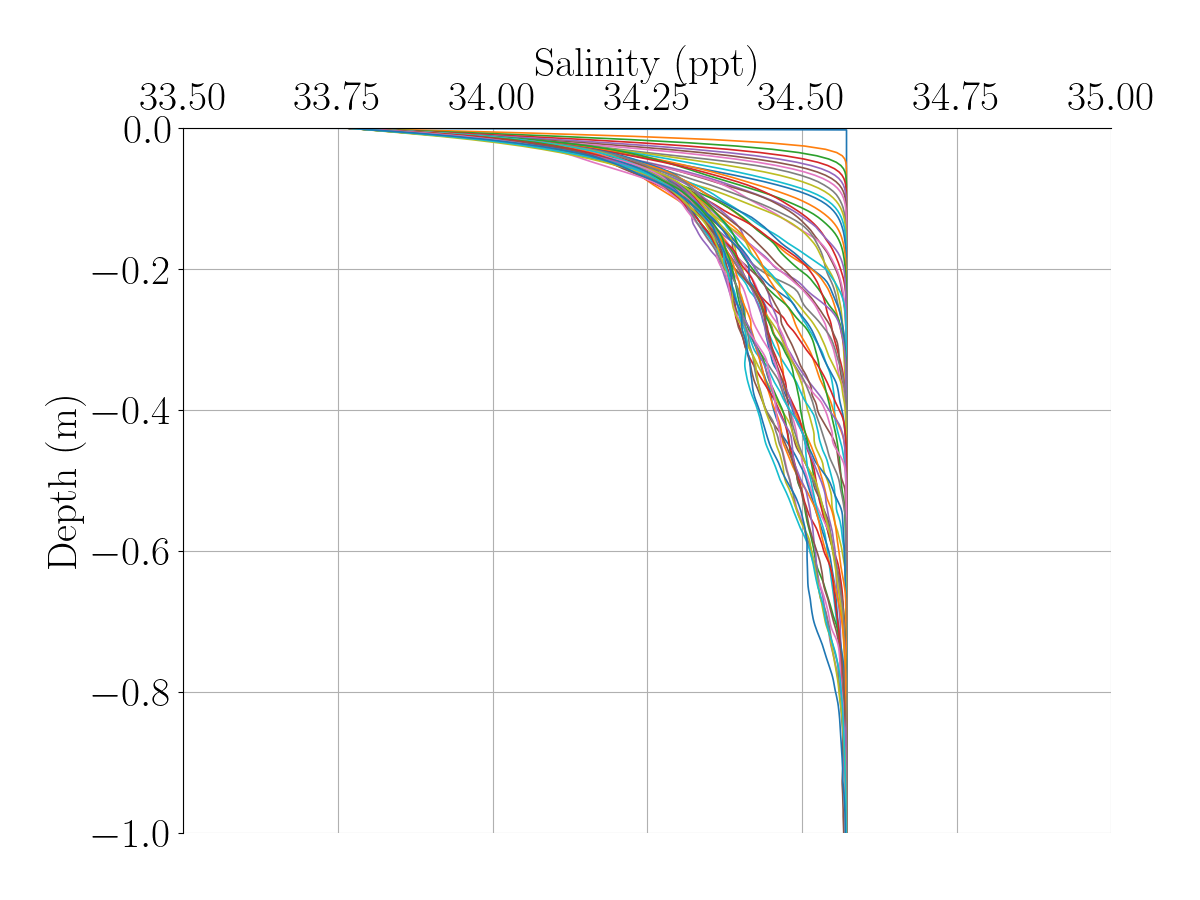
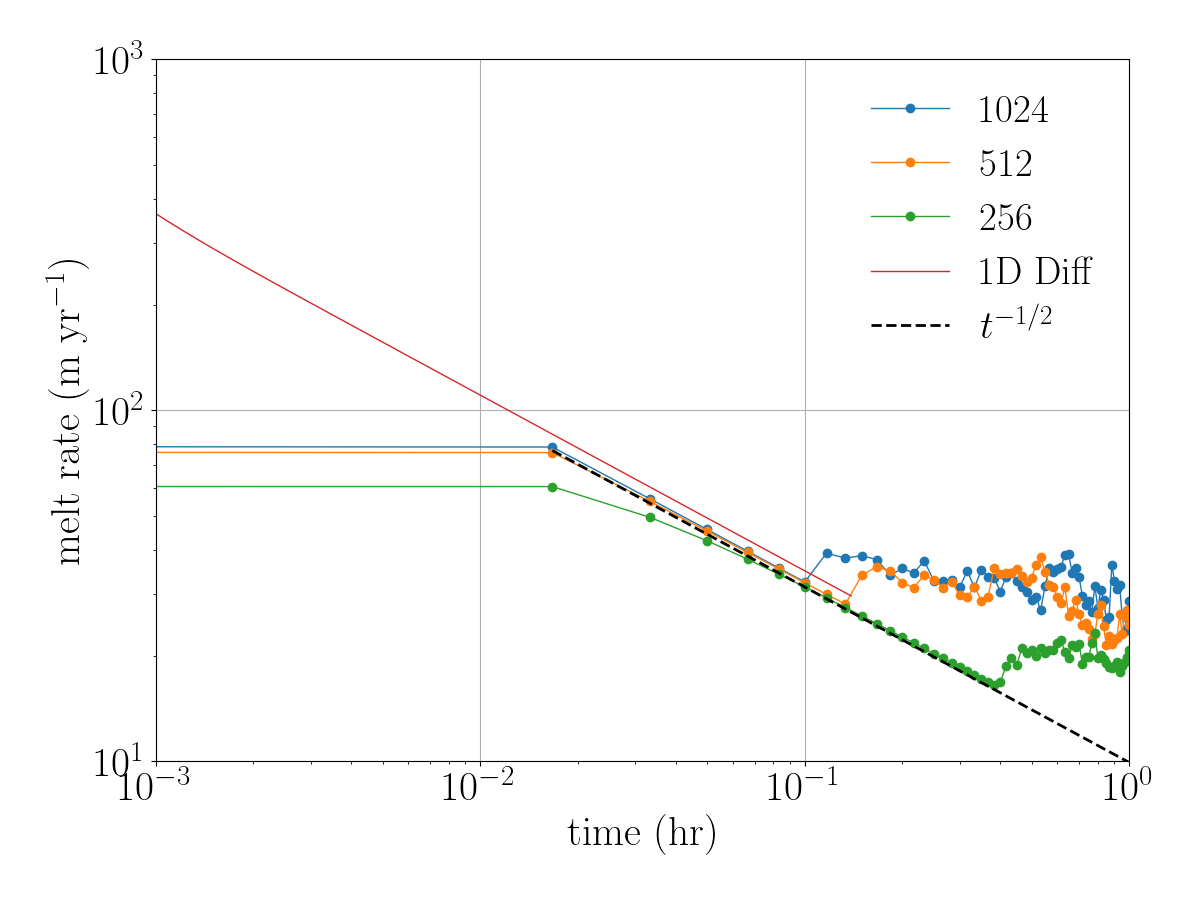
The figure below shows the evolution of the melt rate for the three different resolutions. As expected, the melt rate decreases following a $t^{-1/2}$ trend. When compared to a purely diffusive 1D model, we obtain similar values. We observe a convergence of the melt rate as the resolution increases, indicating that a resolution of 256 points is insufficient to capture the diffusive part accurately. A resolution of at least 512 points is necessary for reliable results. 